How to convert PDF to Excel
- Select or drop a PDF that contains searchable text.
- Extract a page, use the suggested columns or set your own boundaries, and preview the table.
- Add each page you need to the workbook, then create and download the Excel file.
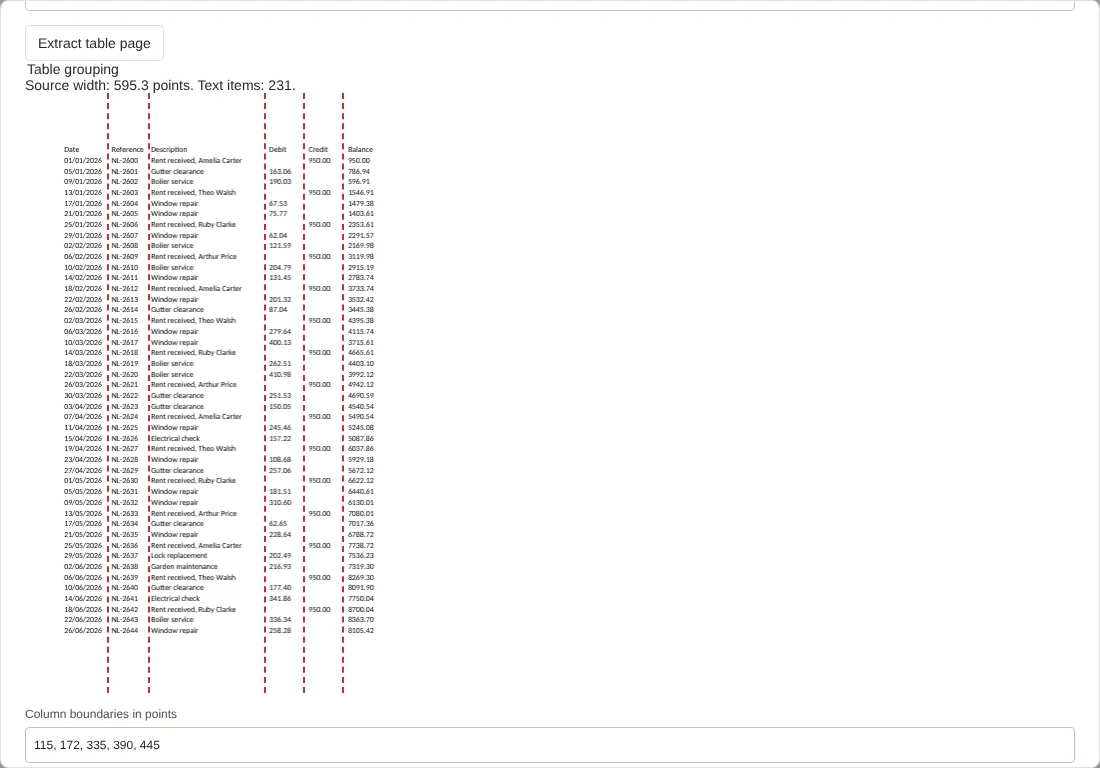
Worked example: a two-page landlord statement
In this test we used a fictional two-page A4 PDF of 14,719 bytes: a landlord statement exported from a spreadsheet. It lists 60 transactions under six headings (Date, Reference, Description, Debit, Credit and Balance), and the heading row repeats at the top of page 2. Debit and Credit are only filled on some rows.
Page 1 had 231 text items. Suggest columns proposed three boundaries, which gave four columns: Date and Reference shared a column, and Debit and Credit were merged, so payments and receipts could no longer be told apart. We typed our own boundaries instead (115, 172, 335, 390, 445). The preview then showed 46 rows by 6 columns for page 1 and 16 rows by 6 columns for page 2.
The workbook was 16,843 bytes with two worksheets, Page 1 and Page 2. Every cell was stored as text, so a balance such as 950.00 arrived as text rather than a number. The repeated heading row appeared at the top of both sheets.
Setting column boundaries by hand
Column boundaries are distances in points from the left edge of the page. The dialog shows the page width (about 595 points for A4 portrait) and draws each boundary as a red dashed line on the page preview, so you can see where it falls before you build the table.
Put each boundary in the white space just before a column starts. Text goes into the column where it starts, so a long description that crosses a line stays in its own column and the preview lists a warning. Enter the numbers in increasing order, separated by commas.
Suggested columns look for gaps that most rows share. They work well on dense tables but can miss columns that are empty on many rows, such as separate debit and credit columns. Check the preview against the page every time.
Row tolerance controls how close in height two pieces of text must be to count as the same row. The default is 3 points. Raise it if one row is split into two, and lower it if two rows are joined. A cell that wraps on to a second line in the PDF becomes two rows, which you can join again in Excel.
Turning the text cells into numbers and dates
Nothing is guessed: every cell is saved as text. That keeps references, account numbers and leading zeros exactly as printed, but Excel will not add up text. Convert the columns you need with Excel's number and date tools, and check that dates are read as day/month/year.
Each page you add becomes its own worksheet, named after its page number, with up to 100 pages in one workbook. If the PDF repeats the heading row on every page, delete the extra heading rows before you copy the sheets into one list. Images, colours, merged cells and formulas from the original are not recreated. For running text rather than tables, PDF to Word or PDF to text is a better fit.
Good to know
- Works best on PDFs exported from spreadsheets or accounting systems, where the text is selectable.
- You control the column boundaries, which helps with tables that have no ruled lines.
- Formulas and charts are not recovered, and every cell is exported as text. Check dates, decimals and leading zeros after export.
Why your files stay on your device
RedactNinja PDF runs in your web browser. When you choose a file, it is read and processed on your own computer, tablet or phone. It is not uploaded to a server, so there is nothing for us to store, read or delete afterwards.
You can check this yourself: open your browser's developer tools, select the Network tab and use a tool. Your document does not appear in the requests. The editor also loads no advertising or analytics code. How to check that nothing is uploaded.
Free, with no sign-up and no watermark
Every tool is free to use without an account. Nothing is added to your documents, and there are no daily task limits. Large files depend on your device's memory, so very big scans may take longer on older machines.
Questions about PDF to Excel
Can it convert a scanned table?
Run OCR PDF first so the page has text, then convert. Check recognised numbers carefully.
Why are some columns merged?
Columns that sit close together can be grouped, and Suggest columns can group them too. Set the column boundaries by hand and preview the table again.
Does it keep cell formatting?
Values are exported as cells. Number formats, colours and formulas from the original spreadsheet are not in the PDF to recover.
Are my files uploaded?
No. The tool runs in your browser and processes the file on your device. Nothing is sent to a server.
Is it free?
Yes. There is no account, no watermark and no daily limit.
Related tools
All PDF tools
Organise
- Merge PDF
- Split PDF
- Organise PDF
- Rotate PDF
- Delete PDF pages
- Extract PDF pages
- Crop PDF
- Resize PDF pages
- Batch PDF
Convert from PDF
- PDF to Word
- PDF to Excel
- PDF to PowerPoint
- PDF to JPG
- PDF to PNG
- PDF to text
- PDF to Markdown
- Extract images
- PDF to PDF/A
Convert to PDF
Edit and sign
- Edit PDF
- Edit PDF text
- Find and replace in PDF
- PDF comments list
- Fill PDF form
- Sign PDF
- Draw on PDF
- Watermark PDF
- Add page numbers
- Bates numbering